 Back to Main Menu




Understanding the modulus function: a comprehensive guide
What do students need to know about the modulus function to ensure they can approach these questions with confidence in exams?
The modulus function is a popular topic in A-level maths exams, so it’s important that your students understand both the underlying algebra and the types of questions they may be asked to answer.
Alongside solving modulus functions algebraically, using a calculator can help with visualising graphs and building a stronger understanding of the topic.
So, what do your students need to know about the modulus function to give them the best chance of exam success?

What is a modulus function?
The modulus refers to the magnitude of a number, regardless of its sign. It is denoted by two straight lines either side of a function or variable – |x| – which represents the non-negative value of x.
A simple way to think of it is as representing the distance from 0 on the number line. As a result, it’s sometimes referred to as the absolute value of a number.
The modulus function is used to calculate the absolute value or magnitude of a number, and will give the same answer irrespective of whether the number is positive or negative.
Another important property to understand is the domain and range of the modulus function. Its domain is all real numbers, as any real value can be substituted into |x|. Its range is [0, ∞) because the output of a modulus function is always zero or a positive value, regardless of whether the original input is positive or negative.

Key properties of modulus functions
When dealing with the modulus function, there are several formula variations to be aware of, as the value of the modulus will always be positive. These formulae appear as follows:
If x is positive, then f(x) = x
If x = 0, then f(x) = 0
If x is negative, then f(x) = –x
For example, for the modulus function f(x) = |x|, then:
If x = −5, then y = f(x) = f(−5) = −(−5) = 5
If x = 5, then y = f(x) = f(5) = 5
If x = 0, then y = f(x) = f(0) = 0
The modulus function always gives a non-negative number as output for all real values of x. Therefore, the modulus function is never equal to a negative number.
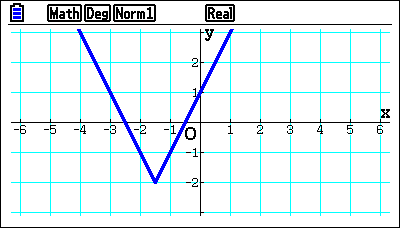
What do modulus function graphs look like?
When answering exam questions, your students need to understand the relationship between the functions they’ve been given. It’s easy to become absorbed in the algebra and lose sight of what the graphs are showing, which can lead to incorrect answers. Sketching or graphing the functions makes it much easier to identify where they intersect and how many solutions there are.
Modulus functions often have a characteristic V-shaped graph. For linear functions, this consists of two straight lines that meet at a vertex. This shape is created because any part of the graph below the x-axis is reflected above it, ensuring the output is always zero or positive.
The V shape provides a simple way for students to recognise a modulus function, and many A-level questions require them to sketch or interpret these graphs. However, your students should also be prepared for non-linear modulus functions, such as |sin x|, where the same transformation applies to a curve rather than a straight line.

Step-by-step guide to graphing modulus functions
When sketching a modulus function graph by hand, your students will usually begin by creating a table of values before plotting the corresponding points. A graphing calculator can speed up this process, making it easier to visualise the graph and investigate its key features.
Graphing modulus functions on the fx-CG100
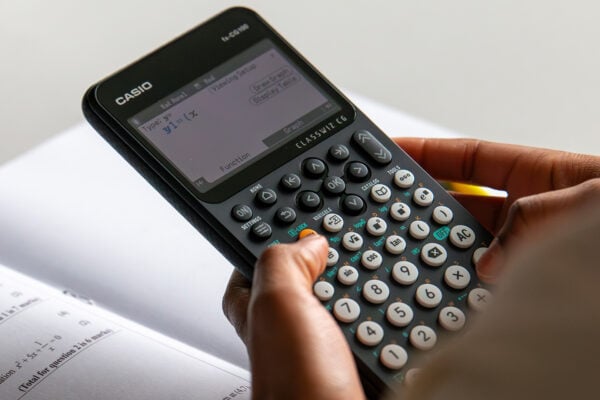
The fx-CG100 includes powerful graphing tools that allow students to plot and analyse modulus functions, making it particularly useful for exploring transformations and checking sketch graphs in A-level maths.
To plot a modulus function on the fx-CG100:
• Press the Home key and select Graph & Table.
• On the function entry screen (Y1), press Catalog.
• Select Numeric Calc, then choose Absolute Value.
• Enter the expression inside the modulus bars, for example x − 5, then press OK or EXE.
• Either press the right tab key or select Draw Graph to display the graph.
Once the graph has been plotted, press Tools and select Graph Solve to investigate features such as the vertex, roots and y-intercept. If the graph isn’t displayed clearly, open View Window from the Tools menu to adjust the minimum and maximum values for the x- and y-axes. The View Window pop-up also appears by default when you draw a graph.
For a more in-depth exploration, you can watch our full video guide to plotting and analysing modulus functions on the fx-CG100.

Evaluating modulus functions on the fx-991CW+ UK
Although the fx-991CW+ UK – our most advanced scientific calculator – can’t plot graphs directly, it can evaluate modulus functions, making it a useful way for students to check values when sketching graphs or solving modulus equations.
To do this:
• Open the Calculate app.
• Press Catalog.
• Select Numeric Calc, then choose Absolute Value.
• Enter the expression inside the modulus bars, substituting a value where required (for example, x = −3).
• Press the right arrow key to move the cursor outside the closing modulus bar.
• Enter any remaining part of the expression, if needed.
• Press EXE to display the result.
Students can repeat this process for different values of x to build a table of values before sketching a graph by hand. It’s also a useful way to check calculations when solving modulus equations or verifying answers obtained algebraically.

How modulus functions appear in A-level maths exams
Your students are likely to encounter the modulus function in a variety of A-level exam questions, from sketching graphs and identifying transformations to solving modulus equations and stating the domain and range of a function.
For example, one question in a past AQA A-level maths paper asked students to sketch the graph of y = |3x − 6| before finding its points of intersection with y = |2x|.
The accompanying examiner report noted that while many students recognised the characteristic V-shaped graph, some lost marks by placing the apex incorrectly. It also noted that while most students found at least one solution to the resulting equation, only around half went on to find both solutions – a useful reminder for students to check for additional solutions when solving modulus equations.
Encouraging your students to sketch graphs alongside their calculations, and check their work using a calculator where appropriate, can help reinforce these key exam skills.

Applications of modulus functions in real life
Although your students will mainly encounter the modulus function in A-level maths, it has a wide range of practical applications. Because it measures the absolute size of a value regardless of its sign, it’s used in areas such as GPS navigation, engineering, finance and data analysis, where understanding the magnitude of a difference or change is often more important than its direction.
FAQs
The notation |x| represents the modulus function, also known as the absolute value function. It gives the distance of a number from zero on the number line, so the result is always zero or a positive value, regardless of whether x is positive or negative.
To solve a modulus equation, consider both possible cases. For |x−3| = 5, solve x − 3 = 5 and x − 3 = −5. This gives the two solutions x = 8 and x = −2.
A scientific calculator such as the fx-991CW+ UK can evaluate modulus functions and help students check values when solving equations or sketching graphs. For graphing and analysing modulus functions, a graphic calculator such as the fx-CG100 provides additional functionality.
The graph of |x| is a V-shaped graph that opens upwards. Multiplying the function by −1 reflects it in the x-axis, so −|x| forms an inverted V while keeping the same vertex.
The domain of the modulus function is all real numbers, as any real value can be substituted into |x|. Its range is [0, ∞) because the output is always zero or positive.
Your students will encounter modulus functions in a range of A-level topics, including graph sketching, transformations, modulus equations and inequalities, and interpreting the domain and range of functions. Understanding these ideas also supports learning in later areas of mathematics.
Blog
- Graphing technology
- Scientific calculators
- Exams
- Curriculum
- Classroom
- Students








Common mistakes in A-level statistics: probability distributions
Read more
Which Casio calculator does your class need?
Read more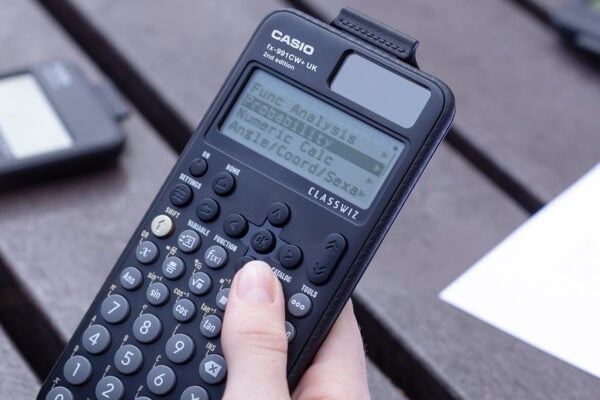
Probability: key challenges and how calculators can help
Read more
Ratio: why is it such a challenge and how can a calculator help?
Read more
Moflin at MEI: how Casio’s AI companion is finding a place in the classroom
Read more
Which Casio calculator does your class need?
Read more
Probability: key challenges and how calculators can help
Read more
Ratio: why is it such a challenge and how can a calculator help?
Read more
Results day: supporting students with their next steps
Read more
Best A-level combinations: a comprehensive guide
Read more
Why is year 7 the perfect time to introduce scientific calculators?
Read more