Back to Main Menu




Common mistakes in A-level statistics: probability distributions

Statistics questions are a common source of avoidable lost marks in A-level maths. Even when your students understand the underlying theory, small errors in interpreting a question, choosing a statistical model or entering information into their calculator will still lead them to the wrong answer.
Here are some common mistakes to look out for in your lessons, along with practical ways to help your students avoid them and use their calculators more effectively.
Not reading and interpreting the question carefully
It’s often tempting for students to dive straight into a calculation once they’ve spotted familiar elements or language in a question, especially under time pressure in exams. But taking a moment to check they fully understand what they’re being asked to do can prevent plenty of avoidable mistakes.
One useful tactic is to ask three simple questions before reaching for their calculator:
- What have I been given?
- What am I trying to find?
- Which method should I use?
Paying particularly close attention to the wording can help students avoid overlooking important information or choosing the wrong statistical model.
As Simon May, former maths teacher and Casio training instructor, explains: “Before they reach for the calculator, students have to feel confident about exactly what they’re trying to find. The handset can certainly help with the calculation, but choosing the right approach is always down to them.”
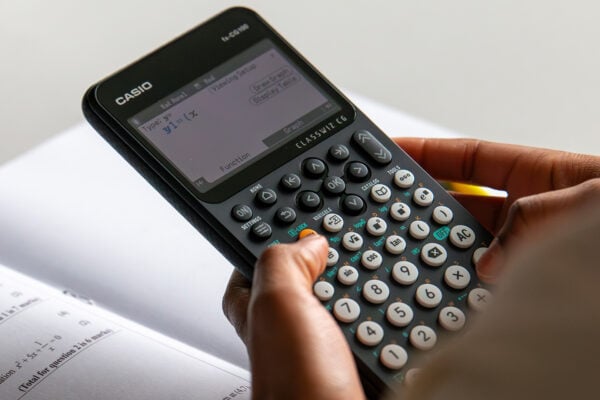
For example, the fx-CG100 graphic calculator’s Distribution app can calculate probabilities for common A-level distributions, including Binomial and Normal distributions. But students have to identify the right model, enter the relevant parameters, choose the probability they want to calculate and correctly interpret the displayed results.
Potential probability pitfalls
Small differences in wording have big implications in probability questions. Students can easily confuse terms such as exactly, at least, at most, more than and less than, or miss an opportunity to use a complementary probability. Another common trap is assuming events are independent without checking whether that’s actually the case.
Translating “at least 4” into X ≥ 4, or spotting that “at least one head” can be found using the complement of getting no heads, takes a moment of pause that’s easy to skip under time pressure. The same goes for independence: students may know the rule but not stop to check whether it actually applies to the scenario in front of them. A quick sketch or a line of notation before reaching for the calculator can make these checks visible.
The fx-CG100 can then take care of much of the number-crunching. Again, the Distribution app lets students calculate cumulative Binomial probabilities directly. This can be particularly useful for questions involving ranges or complements, reducing the need for multiple individual calculations and the risk of arithmetic errors that come with them.
Errors when working with statistical distributions
Even when students correctly identify that a question involves a Binomial or Normal distribution, there’s still plenty of scope for things to go wrong. Choosing the wrong parameters, confusing variance with standard deviation or entering an incorrect value for n or p can all lead to a perfectly plausible-looking – but incorrect – answer.
It’s worth reinforcing what each parameter actually represents before students start calculating. The fx-CG100 can help here in several ways. In the Statistics app, students can enter a dataset and quickly find summary statistics such as the mean and standard deviation, giving them values they may then need when working with a Normal distribution.
You could also encourage your students to sense-check these values before moving on. If a standard deviation looks surprisingly large or a probability doesn’t fit with what they’d expect from the data, that’s a good cue to go back and check their inputs rather than simply accepting the calculator output.
Hypothesis testing problems
Hypothesis testing includes various steps where small errors can easily creep in: defining H₀ and H₁ incorrectly, choosing the wrong tail, or misreading a probability or critical region at the conclusion stage.
A useful habit is to follow the same sequence every time, which might look something like this:
- Hypotheses
- Significance level
- Calculation
- Decision
- Conclusion in context
For a Binomial test at the 5% significance level, for example, students need to understand whether H₁ points to a one- or two-tailed test before finding the relevant probability or critical region. On the fx-CG100, they can use the Distribution app to enter n and p, select the appropriate tail and explore where the 5% critical region lies. Seeing that region on the graph provides a useful visual check on their reasoning.
Simon notes: “The calculator makes finding probabilities and critical regions much easier, but students still need to know what those values mean. The important part is using them to make the right decision and then explaining that decision in the context of the question.”
That final step is worth reinforcing in your lessons: something like ‘reject H₀’ isn’t a complete conclusion. Students should always return to the original claim and state what their test provides sufficient evidence to conclude.
Building strong and lasting habits in A-level statistics
Ultimately, avoiding these mistakes comes down to helping your students develop good habits when working with statistics. You might find it useful to build in opportunities for them to pause before calculating, show their reasoning clearly and sense-check the answers they get.
Regular calculator use can support those habits too. Always having their handset within reach gives students plenty of low-pressure opportunities to explore its statistical tools, recognise when an output doesn’t look right and become comfortable correcting mistakes before they’re working under exam conditions.
For further guidance on how the fx-CG100 can be applied to this topic, head to our Resource Centre, where you’ll find videos on statistical analysis, statistical graphs and a lot more.


Recommended

Do you need a graphic calculator for A-level maths?
Read more
Exploring Distribution mode and hypothesis testing on the fx-CG50
Read more
Visualising and analysing statistics with the fx-CG100
Read more