Graphing Cartesian functions: fx-CG50 tips and pointers

GCSE and A-level maths students spend a lot of time exploring Cartesian functions.
From the simplest linear functions to more advanced concepts such as cubic and exponential functions, this is a broad area of mathematics that can challenge students in various ways.
Graphing and visual analysis of these functions can make a big difference to student understanding, not to mention their ability to pursue their own questions and investigations.
In this blog, we share some insights and tips from mathematician Simon May on how to take full advantage of the functionality of the fx-CG50, our most advanced graphic calculator, when exploring Cartesian functions.
Graphing and analysing Cartesian functions
Let’s start with a fairly straightforward cubic function such as x3 – 3x + 1. Entering this data in Graph mode on the fx-CG50 will produce a curve that looks like this:
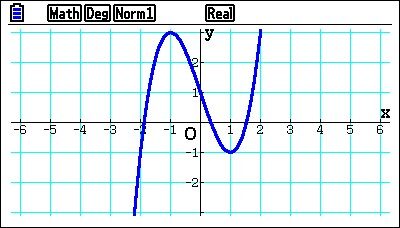
You can then press SHIFT and F5 to access the G-SOLVE menu, which provides a number of tools to analyse the displayed graph.
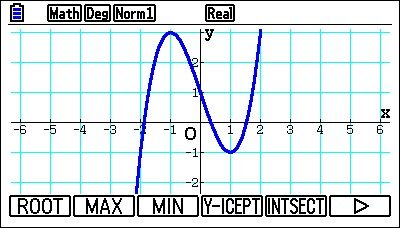
In this case, pressing F1 will show that the three roots of this function are 1.879, 0.347 and 1.532 to 3 d.p. You can also press F2 and F3 to find the local maximum and minimum values, respectively, of the graphed function, while F4 will show where the curve crosses the y axis.
Things get even more interesting when you graph more than one function at a time and analyse how they interact with each other. A particular strength of Graph mode on the fx-CG50 is its ability to display different types of functions simultaneously.
For example, plotting a simple linear function such as y = x + 1 on top of our previous cubic function will produce these two graphs:
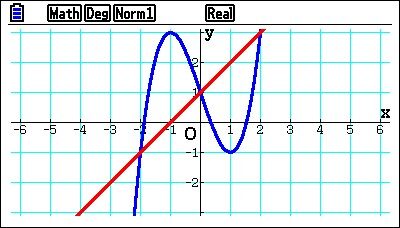
You can then enter the G-SOLVE menu and press F5 to find the coordinates of the three intersections.
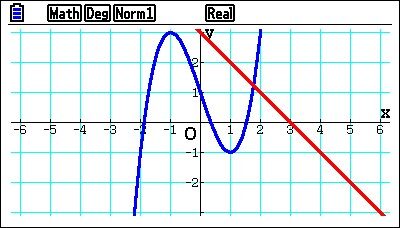
Encouraging students to experiment with different values can help to illustrate changing relationships between functions. Adjusting the linear function to y = 3 – x, for instance, will produce a graph that only intersects with the cubic function once.
“Drawing functions in this way can be really useful for students and can actually make their lives a lot easier,” Simon said. “It gives a clear visual representation of how many equation solutions they need, either backing up their algebraic work, or showing they’ve made a mistake if their number of solutions doesn’t match what’s on the graph.”
Further exploration through modification
The fx-CG50 also allows you to modify Cartesian functions, which opens up new ways for you to approach teaching the topic and for students to do their own investigations.
Taking the example of a trigonometric function this time, you could start off by entering y = sin Ax, using A as a variable that can be changed.
The default value of A is zero, so at first you’ll only have a straight line, representing the constant value sin 0. Instead of drawing, pressing F5 on the graph relation list screen will open the MODIFY function, which lets you change the value of A simply by pressing the left and right cursor keys.
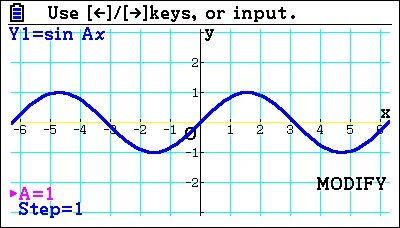
Each time you make a change, you’ll see a yellow ghost representation of the previous graph, which makes it easy to compare them and study shifts in elements such as the roots and maximum points of each curve.
This can open up useful ways to approach ideas that students might find difficult or counterintuitive when exploring transformations of functions.
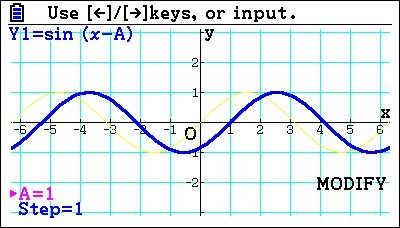
When entering a function such as sin (x – A), for example, they might initially expect the graph to ‘move’ to the left when the value of A is increased, because it’s being subtracted from x. When this function is graphed, however, they will see that the curve actually ‘moves’ to the right, which could prompt interesting questions about what’s actually happening and why the graph is changing in this way.
“Modifying functions graphically is a very nice way of appreciating what’s actually going on,” Simon noted. “It’s also particularly relevant when students start investigating the completed square format at GCSE and A-level, which they can do using a built-in tool on the fx-CG50.”
Another feature of the calculator that Simon recommended when looking at function transformations is DynaGraph. This app lets you adjust a variable within a function and then see the impact these changes have in the form of an animated graph.
“DynaGraph is a really nice feature and I think it often goes underused,” Simon said. “It’s useful for giving a clear visualisation of what’s actually happening to the function and also letting students test their hypothesis of what will happen when they make certain changes.”
Delve deeper into Cartesian functions on the fx-CG50
If you’re interested in taking a closer look at how the fx-CG50 can help you and your students investigate Cartesian functions, you’ll find lots of resources on our website and YouTube channel.
This video in our online resources centre, for example, focuses on transforming functions using variable coefficients, including translations and stretches of trigonometric functions.
You can also find whole collections dedicated to plotting and analysing functions, manipulating functions and many other exciting possibilities on our most advanced graphic calculator.
Upgrade to the fx-CG100
For teachers and students exploring Cartesian functions, the new fx-CG100 is a great upgrade. Building on the fx-CG50, it has a clear colour display, easy-to-use interface, and powerful graphing features, helping students visualise functions and check their work more confidently. Perfect for classroom use or independent study, it makes learning and revision more effective.


