Facing maths challenges: what sets the fx-CG100 apart?
An advanced graphic calculator can bridge the gap between numerical and visual understanding, helping you guide students through complex concepts that can be tricky to grasp with a scientific handset alone.
In this blog, we focus on how the fx-CG100 can add a new dimension to A-level maths studies, looking at examples like drawing functions, exploring 3D surfaces, visualising sequences and graphing probability distributions.
Visualising core maths concepts
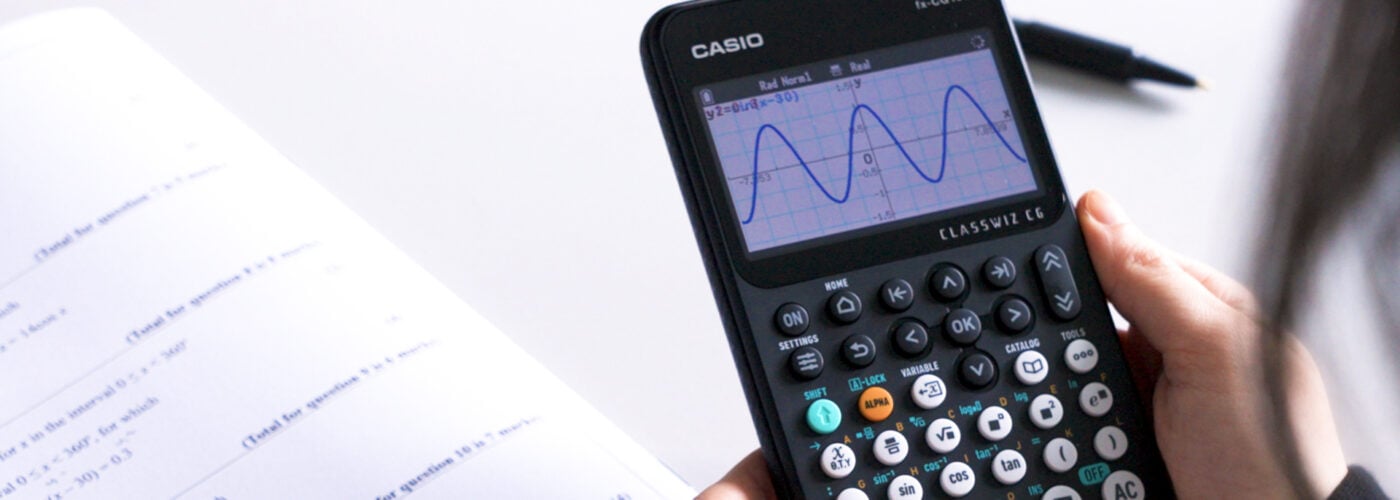
Graphing capability is one of the clearest points of departure between a scientific and a graphic calculator. The fx-CG100 features the newly combined Graph&Table app, which lets students plot functions and instantly view the resulting graph, alongside a corresponding table of values.
Having clearly displayed algebra, graphs and numerical values can help students when they’re learning to interpret key features like turning points and intersections. This could prove especially useful when you’re introducing or reinforcing topics like simultaneous equations and function transformations.
For example, plotting y1 = x² + 3x – 4 and y2 = –2x + 1 together lets students see where these lines meet, to support and verify their algebraic working.
The new left and right tab keys on the fx-CG100 allow one-touch switching between functions, graphs and tables, making it clear and easy to see how algebraic and graphical representations connect.
Learning the handset’s zoom settings means students can adjust the view window automatically or manually to focus on the key points and data they need.
Exploring 3D functions and surfaces
Diving deeper into the fx-CG100’s advanced functionality, the 3D Graph app opens up new ways for students to explore the relationships between variables. It lets them visualise the impact of changes to values and coefficients not only on the x and y axes, but also in terms of z. This can prove crucial for making sense of ideas that can’t be presented in two dimensions.
You might, for instance, plot z = x² + y² to show the shape of a curved surface, then adjust parameters to see how gradients or curvature change. Students can rotate and zoom in on different parts of the graph to examine it from different angles, giving them a clear sense of how the surface behaves.
The 3D Graph app can come in particularly useful if you’re exploring advanced A-level topics such as coordinate geometry, vector planes or functions of two variables, where working on paper can only take you so far.
Being able to manipulate and interact with surfaces also helps students to develop their skills in spatial reasoning and draw conclusions from visual cues.
Bringing sequences to life with Recursion
Recursion is another specialist app on the fx-CG100 that can’t be found on any of our scientific calculators.
It’s designed to help students explore how terms in a sequence develop and relate to one another. The app works with general terms as well as two-term or three-term recursion formulas, automatically generating a table of values and a graph from your input.
Students can enter an initial value and a recurrence relation, such as uₙ₊₁ = uₙ + 2n + 1, to see how each new term is built from the previous ones. The app then displays the sequence both numerically and visually, making it easier to identify growth patterns, convergence or divergence.
For teachers, this specific graphic calculator capability can offer a quick way to demonstrate and view how recursive relationships behave.
Switching between the fx-CG100’s Sequence and Table tabs helps students link the algebraic formula to its visual representation, offering a useful extra dimension when studying sequences, series and iterative models at A-level.
Deeper analysis of probabilities with the Distribution app
Both the fx-991CW – our most advanced scientific calculator – and the fx-CG100 feature a Distribution app for probability work, but the key difference between them is visualisation.
The fx-991CW supports calculations involving binomial, normal and Poisson distributions, but the fx-CG100 takes things a step further, providing the option to view these concepts as clear, interactive graphs.
Adding a strong visual element can make questions relating to abstract data and statistics easier to grasp. For instance, plotting a binomial distribution gives students options to experiment with how changing parameters such as n or p impacts the graphical representation.
Similarly, exploring regions of normal distributions can contribute to an understanding of probabilities as areas under the curve, rather than just numerical results.
The highly visual approach enabled by the Distribution app is also helpful when exploring hypothesis testing. Taking a simple example, you could model a normal distribution with a mean of 50 and a standard deviation of 10 to represent a population. Setting a significance level of 5%, students can use the graph to highlight the two tails of the distribution – the relevant regions for a two-tailed test.
If they then enter a sample mean, the app will show exactly where this value lies in relation to the critical boundaries. Seeing the point plotted inside or outside the shaded region will make it immediately clear whether or not the value is statistically significant.
Exploring further…
If you’re interested in taking a closer look at some of the unique features and capabilities of the fx-CG100, you’ll find plenty of materials on the Casio Education website.
In our resources centre, for example, you can view how-to videos focusing on: