Using the fx-CG50 for Statistics

In this article, James Davis, Head of KS5 Further Mathematics, Newstead Wood School, discusses the powerful statistics functionality of the fx-CG50 calculator. From mastering the different menus to confidently navigating the various modes, James guides you through the steps required to ensure your students are well-prepared to use the statistics functions on their calculators in any exam setting.
Don’t be a Statistic said no Statistician ever…
In life, as in exams, we can’t get rid of Stats – it’s everywhere. The fx-CG50 calculator is just the tool to tap into the world of Stats intuitively. It’s a powerful device with various statistical functions built into it. Summary statistics are elementary to calculate with the fx-CG50. The statistics mode can be accessed by pressing menu and 2.
Example: Find all the summary statistics (Mean, Median, Mode, Standard Deviation etc. ) for 3,4,6 and 7
The students can enter the data in List 1. To enter each value, students have to press the `EXE` key. Then the screen would look something like this:
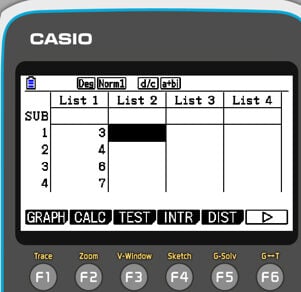
After entering all the values, the CALC option can be accessed by pressing F2. This option would allow calculating the summary statistics from the entered data in List 1. To confirm the calculator knows where the entered values are, press the “Set” option by pressing F6 and set up as below:

Then press Exit.
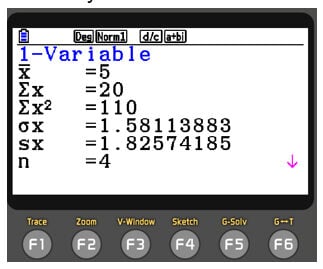
The 1-VAR option in the CALC mode of the fx-CG50 calculator is a statistical function used to calculate descriptive statistics for a dataset with a single variable, which is X here. It allows you to find basic statistical measures such as the mean, standard deviation, variance, minimum and maximum values, and quartiles.
To access the 1-VAR option, press F1. The resulting screens show valuable statistical information related to our dataset in List 1. From the order top to bottom in the following image, these statistics are mean, sum, sum of squares, population standard deviation, sample standard deviation and number of data items. (Pressing F6 will allow the user to see further summary statistics such and medians and quartiles)
If you wish to calculate summary statistics for single variable data with frequencies, e.g. Find the mean median, mode, and standard deviation of the data below

Then in List 2, enter the frequency values for each X value.
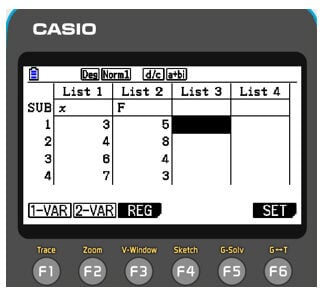
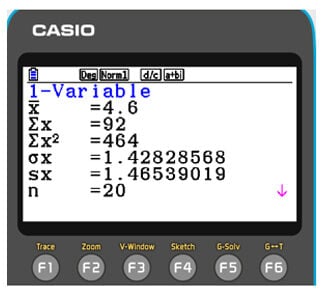
Once you are done, to set the values, press F6. Then choose List 2 as the frequency. Once you are done, to set the values, press F6. Then choose List 2 as the frequency. Then press exit. You will then be able to see the calculated statistics by pressing F1. The result should look something like the following.
The correlation coefficient is your friend
When the Christmas season is near, the number of gift items sold increases. This is a positive correlation. Students are expected to be able to use their calculators to calculate correlation coefficients. Below is how to do this using the fx-CG50.
E.g. Calculate the correlation coefficient of the data below.
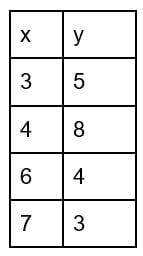
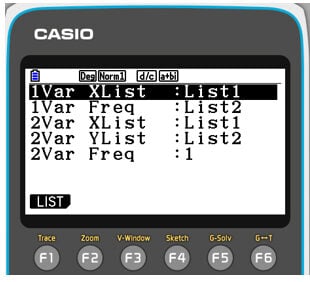
After accessing the statistics menu, (menu, 2), list 1 should be filled with X values, and List 2 should be filled with Y values. After filling the two lists, you have to click the CALC (F2). Then; check calculator is set correctly by pressing SET F6. You can then check if the 2-VAR data is showing the correct lists. Finally press exit.
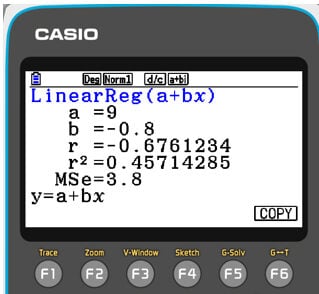
Then click REG to access To acces the regression menu, press F3. Then select the linear regression model “a+bx”. This is similar to the traditional straight-line formula of “y=mx+c”. You can do so by, F1, F1. This gives the handset the correlation coefficient ( r ) . (along with other valuable data such as the y-intercept and gradient of the line of best fit)
Distributions and random variables
Binomial and normal distributions are two important probability distributions used in statistics and probability theory. When only two outcomes are conceivable for each trial and a fixed number of independent trials, the binomial distribution is frequently used. Conversely, the normal distribution is used to model continuous data that follows a bell-shaped curve.
For example, consider a random variable X which follows a binomial distribution with parameters n = 50 and p = 0.2. Here “n” is the number of trials, and “p” is the probability of success. Its notation can be written as X-B(50,0.2), and imaging the question asks to find P(X>9), which is the probability of X taking a value greater than 9.
To solve this, students can go into Statistics mode (MENU 2) and then the binomial distribution menu (F5 (DIST), F5 (BINOMIAL), F2 (Bcd)) on the handset and enter the values, including the number of trials and probability of success.
After that, when executed, they can see the resulting probability. An exceptionally powerful mode on the calculator is the Distribution app (MENU I) Here, all the common distributions can be modelled.
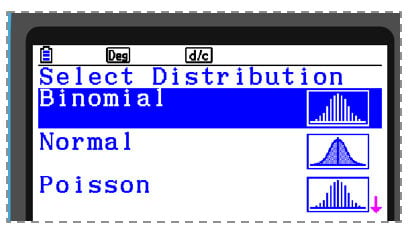
Selecting the Binomial option, the previous example can be solved by pressing F3 and inputting the parameters and a more visual solution of the probability is displayed.
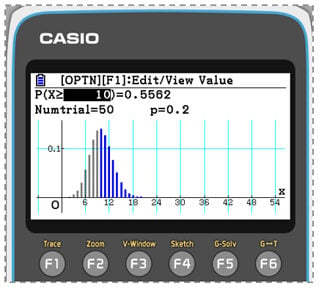
They can also edit the values of X or the probability (e.g. the 10 or the 0.5562 in this case) and see the changes in real time. For example, changing the probability to 0.05 will give the closest value of n, which has a probability of 0.05. This can be very helpful in finding critical regions in binomial hypothesis testing during an exam.
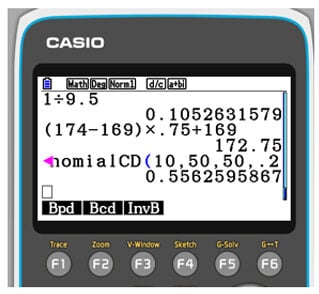
A third way of calculating binomial probabilities is directly in Run mode (MENU 1). Here press OPTN, F5 (STAT), F3 (Dist), F5 (Binomial), and F2 (Bcd) and input the parameters in the same order as they were in Stats mode – see below:
The Normal distribution, also known as the Gaussian distribution, is an important continuous probability distribution that is widely used in statistics and probability theory. It’s bell-shaped and symmetric around its mean value, with most data clustered around the mean and decreasing towards the tails. It’s a versatile distribution that arises naturally in many real-world applications and is used to model various phenomena in fields such as finance, engineering, and social sciences. Even the difficulty level of a standard exam paper is maintained so that the marks scored by students are normally distributed.
Consider the random variable X which follows a normal distribution as noted.
X-N(5,9)
Here, if the question is given to find P(3<x<8), the first thing students have to do is open the normal distribution menu. As with Binomial distributions, this can be done in a variety of ways. For example, In the distribution app (MENU I), after entering the values, they can see the distribution nicely drawn on the screen, which they can manipulate by adapting the values of X or the probability as required.
Test mode for normal distributions & SolveN
Some of the calculator’s more advanced features are outlined briefly below:
The Test mode on the fx-CG50 calculator is useful for performing hypothesis test questions. To explore it, find a normal distribution hypothesis test from any UK A-level mathematics exam syllabus and then go to Statistics Mode (MENU 2) and then F3 (TEST), F1 (Z), F1 (1-Sample) and F2 (Var) and input the relevant parameters from the question. If studying further Mathematics or Statistics A-level then there are several options here that are also useful (e.g. Chi-squared tests, t-tests, ANOVA tests etc. ).
SolveN is an incredibly powerful tool that can be used to solve pretty much any equation with a numeric answer. To access it go into RUN mode (MENU 1) and then press OPTN and then F4 (CALC) and then F5 (SolveN)
Both Test mode and SolveN can be powerful tools for analysing data and making statistical inferences in a variety of fields.
Book a training
The fx-CG50 is packed with many wonderful settings that can help students build confidence and reduce stress because of time constraints in exams. Would you like to dive into the world of the fx-CG50 graphic calculator and get the most out of it? Then sign up for our free skills training sessions.


