Using graphs and experimentation to crack modelling problems

Let’s talk about modelling problems: something you and your students will no doubt be very familiar with.
Whether it’s analysing tidal variations or predicting the behaviour of a ball after it’s thrown into the air, there are endless ways in which examiners can test students’ knowledge by presenting them with real-world situations.
But just because modelling scenarios are as old as the proverbial hills, doesn’t mean you always have to tackle them in the same way.
In this blog post, our maths expert, Simon May, shares some examples of how you can utilise the full potential of graphic calculators to unlock multiple approaches to these problems.
The value of varying your approach
When you have a calculator that combines graphing tools with numerical and algebraic capabilities, you have plenty of ways to work through modelling questions with your students.
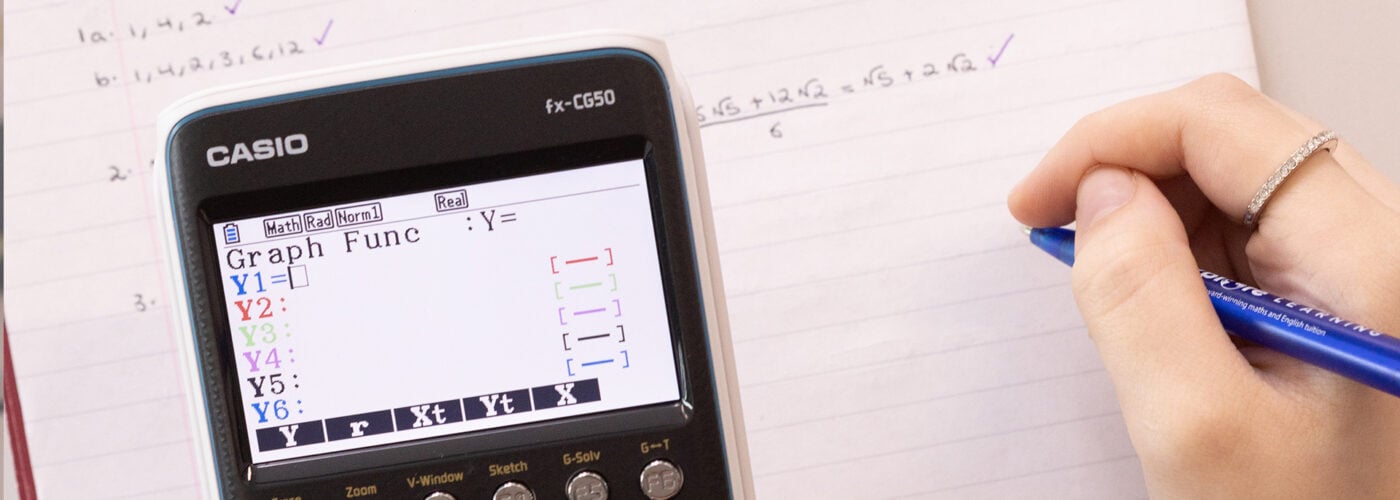
Let’s take simple mechanics problems involving SUVAT equations as an example. If you want to start off numerically, you can do that in Equation mode on the fx-CG50, which allows students to input the variables of U, V, A and T that they’ve been given and attempt to find the missing values.

This can help students to build their fundamental understanding of what’s happening in the equation, before building on that by feeding the data into a graph, if they have a calculator with that capability.
The fx-CG50 is the handset we recommend for A-level maths students – as well as those going into greater depth at GCSE – specifically because it combines so many features. As well as graphing, it gives you access to advanced numerical capabilities and the SolveN feature to solve equations.
Graphing in context
When it comes to the unique benefits of graphing when tackling modelling problems, Simon gave us some specific examples in relation to an exam question exploring projectiles – specifically a ball being kicked into the air.
Students might be asked to come up with a function that represents this scenario – based on information such as the maximum height of the ball and the point where it lands – and then to find certain missing values.
Working graphically, they can experiment with inputting functions and tweaking certain variables to see if the resulting graph corresponds with the information they know is correct.
In this example question, they can adjust values to change the shape of the curve – which they can do easily with the fx-CG50’s Modify function – in order to work out its maximum value and the point of intersection with the x axis.

Students and teachers who are fully aware of the functionality of their calculator can then go deeper into the question – and gain more confidence in their answer – by solving it numerically or even substituting values and presenting it as a simultaneous equation.

Sidestepping simple mistakes
Simon also offered an example showing how the clarity and visual feedback offered by graphs can help students avoid small mistakes that could have major ramifications in their final answer.
When given a modelling problem and an accompanying function with parameters that need to be fixed, students who are used to working graphically will be able to picture a graph that represents the scenario accurately.
Then, when they input their values into the graph, they will get an immediate visual representation telling them if they’re on the right track or not. If, for example, the curve is moving in the opposite direction to what they expected, there’s a good chance they have a negative value where they should have a positive.
This kind of mistake could be easily missed when working numerically, but is glaringly obvious on a graph.
“Being able to draw things just makes life so much easier for students,” Simon noted. “And for teachers, if you can back up the language you’re using by displaying the graph of a function, that reinforces students’ understanding.”
Graphing power in the palm of your hand
For teachers who have reservations about adopting graphic calculators, Simon suggested looking at it like this: the chances are you’re already using the technology.
Whether it’s GeoGebra, Desmos or any other application, you’re probably already familiar with graphing software. Having instant access to this functionality on a calculator offers some very specific benefits, such as:
- The option for students to do more independent work and exploration
- Not having to think about sourcing laptops or tablets to access software, or moving to a computer room
- Calculators can be taken into exams
- Benefits across all areas of the curriculum, not only in maths but in other subjects as well
We understand that, despite all these advantages, moving to graphing technology can feel like a daunting change.
That’s why we strive to provide a range of resources to make tools like the fx-CG50 as easily accessible as possible to schools.
You can sign up for an introductory training session – absolutely free and led by an expert with in-depth knowledge of the calculator – and also check out some of the videos and other resources available on our website. We also offer loan sets and other initiatives designed to provide maximum support to schools, so just get in touch and let us know how w


