Using graphing technology to plot and analyse 3D lines

As your more confident A-level students venture into the world of Further Maths, one concept they’re likely to come across is plotting and analysing lines and planes in 3D.
From a mathematical perspective, this isn’t necessarily the most challenging topic your Further Maths students will encounter. However, it is very specific in its rules and requirements, and it demands a certain level of confidence in skills like writing out algebra and doing matrix calculations.
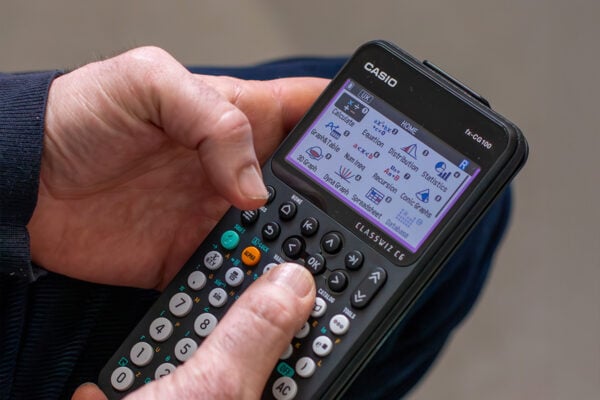
This is the perfect example of a topic that really comes to life when students have access to a graphic calculator for A-level Maths and Further Maths. With that in mind, we asked our maths expert, Simon May, for his thoughts on using the fx-CG50 to explore 3D lines and planes.
Venturing into the 3D world
For A-level Maths and Further Maths students, plotting 2D graphs and thinking in terms of x and y will be second nature. When you enter the 3D space and add z into the equation, however, things get more complicated and students must do more complex calculations to get the answers they need.
“It’s a significant next step,” Simon noted. “It’s taking things up a notch from equations on a straight line in 2D, and students need to think in a more cohesive way about the information they have and what else they need to know.”
When it comes to teaching this topic and supporting students as they get to grips with it, there are obviously certain limitations to using a whiteboard and pen to represent concepts in three dimensions.
Similarly, graphing software packages have disadvantages such as not enabling fully independent exploration by students and not being accessible in exams.
For Further Maths students who want to really get into this topic and give themselves the best chance of success in exams, there’s no substitute for having graphing technology in the palm of their hands.
Graphing and exploring 3D lines
Having the ability to plot 3D lines and planes means students can rotate graphs horizontally and vertically, to get a real sense of viewing them in three dimensions.
It’s also possible on the fx-CG50 to draw more than one line in 3D. This enables investigation of common exam challenges such as ascertaining whether two lines are parallel or intersecting, and if it’s the latter, at what point they intersect.
This is where being able to visualise lines in three dimensions becomes crucial, as the perceived relationship between two lines can change when viewed from another angle.

Further Maths examinations could also ask students to explore the relationships between lines and planes, which could be anything from the angle or point at which they intersect to whether they are perpendicular to one another.
“This all relates to vector calculations that students can approach algebraically, but the fx-CG50 has some really nice functions that can calculate the angles and other relationships between lines and planes,” Simon said.
He also noted that, in an exam scenario, students can use the calculator’s graphing features to check the accuracy of their algebraic work. Further Maths exam questions are likely to test students’ abilities by presenting them with a lot of unknowns, which means they will have to do the algebra and other underlying work first, before using their calculator to check what they’ve done so far is correct.
As a side note, it’s important to be aware that there are two different exam modes on the fx-CG50. The A-level Maths exam mode allows access to the calculator’s 3D Graph app, but the IB exam mode does not.
Making the most of the fx-CG50
Before diving into plotting lines in three dimensions with your students, the first thing to check is that they have the 3D Graph app installed on their device. If they don’t, all they need to do is connect their calculator to a computer via USB and download the add-in from the Casio website. https://education.casio.co.uk/support/os-files/
Once they’re up and running with the app, they will be able to plot up to three lines or planes in 3D, with extra options to draw spheres, cylinders or cones. The app also supports the different required formats for equations for lines and planes.
Furthermore, students can plot a line through a point with a given direction vector, which provides a nice opportunity to link 3D graphing back to equations of 2D lines as represented by y = mx + c. Thinking about the direction of a 3D line as equivalent to a two-dimensional gradient can help students make connections between this new area of 3D graphing and the 2D methodology they’re already familiar with.
The various potential uses of the fx-CG50’s 3D Graph app are covered in more detail in a series of videos in our Resources centre, which focus on:
Exploring 3D lines and planes is an exciting feature of the fx-CG50, but the functionality of our most advanced graphic calculator extends well beyond this.
If you’re interested in finding out more about what it can do, why not book a place on one of our free introductory training sessions?
You can sign up here.


