The power of graphic technology in ever changing school environments

While teachers and students have been keen to get back to the classroom, the last few years have given us new techniques that can be blended with what we do in the classroom.
We spoke to Melios Michael, Assistant Headteacher, to understand more about how his Maths department at Hamstead Hall Academy in Birmingham is using graphic technology to enable learning and support students during the ever changing school environments, and how teachers can bring the best practices from lockdown to in person learning.
Bringing the best practices from lockdown into the classroom
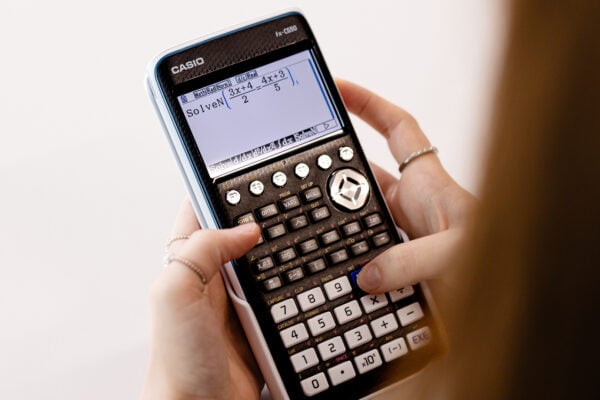
We can now bring along the best practices learned during lockdown to enhance the classroom experience. During lockdown, teachers were challenged to find alternative ways of teaching online, and it allowed us to look for new websites and new ideas. For example, using a graphic tool to explore a quadratic and then see the different solutions of that answer. It brought maths more alive, and we don’t want to lose that.
It includes simple things, like using the interactive board and adding notes to slides so they can be shared, rather than using the old traditional whiteboard markers. Or, for instance, continuing to share resources on Google Classroom or Teams, like website links or emulator screenshots for students to explore at home.
Understandably, not everyone’s on the same journey, and some teachers are more comfortable returning to how things were before lockdown. But now is the chance to include more visual and interactive elements, like using the emulator in class or sharing websites, to enhance lessons and the overall learning experience.
Resourcing graphic calculators within the classroom
At Hamstead Hall Academy, A level students typically have their own graphic calculator, and for the ones who didn’t, the school lent them out during lockdowns so that they could have them at home. Teachers then used the emulator during live lessons to show students how to use the calculators and, more importantly, as a visual aid to learning.
For the younger students, the school has a borrowing system for teachers to use the graphinc calculators during lessons. Due to health and safety, it had to be cut back during the pandemic, but it’s now back up and running.
The borrowing programme meant the school could expand its use of graphic technology to younger years. And not just to Key Stage 4; they also went to Key Stage 3, preparing the grounds for Key Stage 4 especially for the able students. When they come into Key Stage 4, they are already familiar with the device and could focus on applying it to learning.
The pandemic set up back the programme, but with it now restarting, it’s enabling students to build their confidence. It’s also important to recognise that restarting the programme isn’t just a school policy; it’s also about the teachers having confidence themselves. And you can’t push that. It’s like everything else with COVID, you remove the policies and the regulations, but it’s up to the people, their confidence and how soon they can get back to normality. But they’re slowly coming back, and it is positive because they’re using the devices in the classroom again.
Introducing the devices to support the why, not the how
When the school first introduced the borrowing programme, teachers planned lessons on using the calculators, which wasn’t the aim. The purpose was for the calculators to support and enhance the classes, not teachers thinking, “Okay, what lesson can I plan to use that?”
The school used peer-to-peer planning meetings, observations, and discussions to help teachers think about how using the graphic calculators could enhance their lessons, go deeper into a topic, and visualise the maths.
It’s a shift in how we think about using technology in the classroom. Many teachers will recognise this journey from when laptops or booking computer rooms became commonplace and the change in thinking from how I can use these tools in lessons to understanding how this technology supports students to unpack the why behind how something works.
A bit like using mini whiteboards to get a quick answer from everyone, when the graphic calculators can help support learning, you want them to be there, on the desk and ready to use. It means that the device is already there as soon as a teacher feels it’s a good opportunity to explore further. Or, if a student asks, “Why does that work?” instead of answering it, teachers can say: “Let’s explore it.”
Improving understanding and saving time
Part of the feedback from some teachers is that introducing graphic calculators can take more time. So there is a mindset change to support needed for teachers to help them recognise that in the long run, it can save time.
For example, using the device to improve understanding means that when it comes to revision time, you’re going to go faster because students have a clearer picture in their heads of the topic. That’s when you’re going to save time. It might feel slower, but it saves time if the students don’t need as much revision. It saves time if topics are taught with the right quality and depth.
When we rush to teach the schemes of work and prepare them for the exam, we sometimes can forget the why, and we’re more interested in the what and the how and then ticking off the box that we covered another topic. But then you have to do revision or reteach the entire topic again.
The devices and the technology come in because they’re very efficient ways to achieve this quality and depth. You could do this on pen and paper, but that’s even more time-consuming. If you have to draw the different graphs, observe students, and discuss what’s happening, there’s a lot you need to remember and prepare for the lessons everything from how the shape looks, plotting it, the scale and preparing a table of values. These skills are, of course, valuable, but the question to ask is if they’re important for the lesson objective? If the lesson goes deep into another topic, but half the time is spent preparing graphs, it distracts from the main purpose.
Another option is to sit down, create those sketches in advance, and hand them out. But something is lost when the visual is not dynamic; that dynamic element of using a device, typing it in, seeing how it changes, and having students change some variables themselves brings the experience alive for students.
The benefit of graphic calculators over laptops and other graphic technology
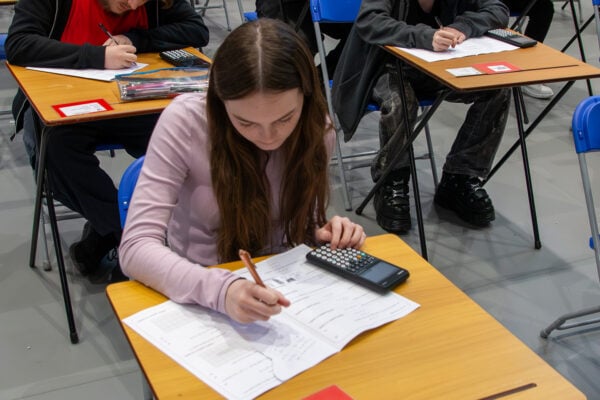
First, of course, there’s the fact that students can use calculators in their exams. One of the biggest advantages of having the devices in the classroom is that if the students build confidence, they can take this into the exams.
But, more than this, there’s the consistency that they bring. With a lot of graphic technology, you have to build it yourself, which is fine for simple graphs. However, if you want to combine it with other topics, the graphic calculator has a methodical approach, so you have consistent ways of solving problems. Instead of focusing on technology, it enables students to focus on exploring the maths.
Using tools on the laptop, you’ll get the same result eventually. But there are more different tools and things around that you have to do to get it to explore to the same depth as you would with the graphic calculator.
If you’d like to know more about using the fx-CG50 graphic calculator, we provide free training for teachers. Our skills training sessions are run by teaching experts who know the fx-CG50 inside-out. We also have a range of resources available in our extensive resource centre it even includes a build your own resources collection feature to make it easy to find the resources most relevant to you.