Key fx-CG100 features to help students learn and explore maths

The fx-CG100 is our latest graphic calculator, designed with a wide range of features to support teaching and learning.
In this blog, we put the calculator’s functionality into context by focusing on some of the tools and operations that could prove most useful for you and your students.
Solving and graphing equations
The fx-CG100 offers various ways to explore and solve equations, including the dedicated Equation mode, the SolveN feature and the new Graph and Table mode.
When it comes to the core knowledge and understanding required to solve equations, students can’t get that from their calculator. If you start year 12 with a refresher on quadratics, for example, students will need those fundamental skills in areas like algebraic manipulation, substitution and calculations within the quadratic formula to keep up.
What the calculator can do, however, is give students confidence and reinforce their understanding by confirming their solutions and opening up new ways to visualise and explore problems.
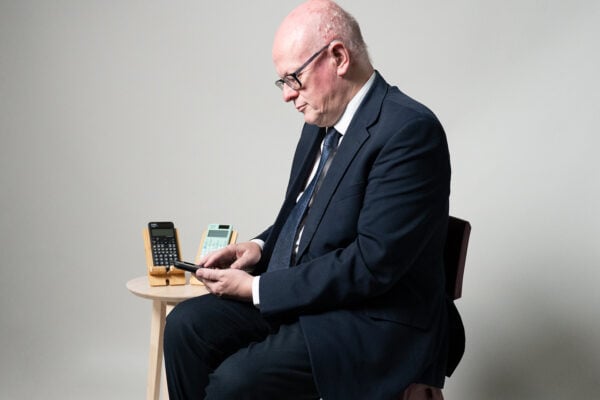
Simon May, our Principal Technology Trainer here at Casio Education, stressed that the fx-CG100 is much more than just an answer-checking machine. It’s a diverse learning tool that can be applied in different ways, depending on the nature of the topic, and teacher and student preferences.
As they continue their investigations into quadratics, students can always use functionality like SolveN to confirm numerical solutions and get their answers as exact values, such as surds.
But they can also experiment with methods such as factorising and using the completed square format, which can be graphed to illustrate what’s happening and where the curve crosses the x axis.
“I think when we talk about equation solving on the fx-CG100, it means much more than just using the numerical methods on the handset,” Simon said.
“It’s a combination of using SolveN, say, for those exact values, and also graphing for clarity and deeper understanding. It’s not just one app or one method.”
Graphing in colour
The fx-CG100’s high-resolution colour display is much more than a cosmetic feature. It can play a key role in helping students distinguish between multiple functions and make sense of what they’re seeing on the screen.
Having the ability to plot functions in different colours enables easier distinctions when working with overlapping or transformed graphs. Students can clearly see where graphs intersect, where lines cross the x axis and how the shapes of curves compare to each other.
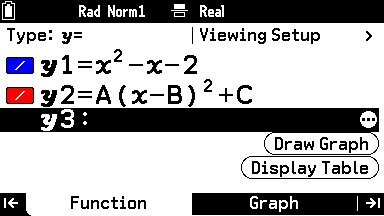
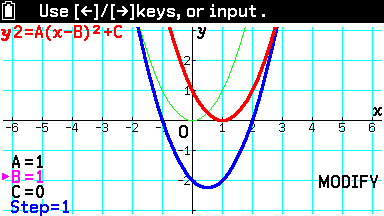
In Graph and Table mode, they could start off with a simple quadratic, such as x2 – x – 2, rendered in blue. They could then choose to graph one of the calculator’s built-in functions, such as A (x – B)2 + C, in red to explore the completed square format.

The Modify functionality allows them to change the values of A, B and C to see how these alterations cause the graph to stretch and shift both horizontally and vertically.
With each tweak they make as they try to match the red graph with the blue one, students will see a green ghost image of the previous curve, making it entirely clear what has changed.

“The colour display and the bright, pin sharp screen make it a lot easier to understand what’s happening and changing,” Simon said. “It’s not just colours – you can also change the format of lines to dots or dashes, making things even clearer and easier to differentiate.”
Analysing and summing sequences
Moving onto the topic of sequences, the fx-CG100 offers various tools for different levels of exploration – from simple patterns at GCSE to more complex iterations and summations in A-level maths.
In Graph and Table mode, students can quickly generate and view sequences by inputting a function, such as x2,and producing a table for a chosen range of values. This mirrors the way many teachers like to introduce sequences: by asking students to list out terms and look for patterns.
As the topic becomes more advanced at A-level, students will work with formulae to determine specific terms in sequences. They can enter the data and variables they have directly into Calculate mode on the fx-CG100 to find the terms they need.
Catalog also provides access to the calculator’s Summation functionality, which uses sigma notation to help with finding the sum of a sequence.
It’s even possible to generate and explore sequences in Statistics mode, by adding the relevant data in the list editor and accessing options for analysis in Catalog, such as summing the terms in the list.
It’s all connected
One of the most important points that Simon wanted to make is that – like the various topics that make up the maths curriculum – the different modes on the fx-CG100 are all connected.
The calculator allows students to experiment with different inputs and representations – from functions, formulae and equations to graphs, lists and tables – depending on the problem they’re tackling and how they want to approach it.
Simon said: “Playing around with different apps and functionality on the calculator is a great way for students to broaden their thinking and take a wider view of the maths they’re learning.
“It soon becomes clear that there are many ways to tackle a problem and to visualise a solution.”
Looking for more insights and guidance on how to take full advantage of the fx-CG100 in your lessons? You’ll find plenty in our resources centre, including:
- Links to upcoming webinars on adopting the fx-CG100 and graphic calculator technology in general
- A video guide to navigating the fx-CG100
A video guide to solving inequalities on the calculator


