How to motivate your students to become more interested in maths?

As a teacher, you know if you want to get someone interested in learning, finding a gap in what they know can pique their curiosity. But sometimes getting students motivated in maths can be easier said than done. We recently sat down with mathematician Simon May to get his top tips to get your students more engaged in maths.
Start by identifying gaps in their existing knowledge
When starting out with engaging students, focus on something they don’t know that builds on an area of maths where they’re already confident. For instance, A Level students will be familiar with quadratic functions from GCSE. But do they know that they can apply quadratic functions in the context of a mechanics problem?
Whether students realise it or not, if a ball is thrown, they can model a ball’s flight as a quadratic, and this example allows them to predict where the ball will be in space at any time. They could explore further and map the conditions to throw a basketball into a hoop for a given height and distance. And this all links to the idea that if you want people to be interested in learning maths, you could show them something new.
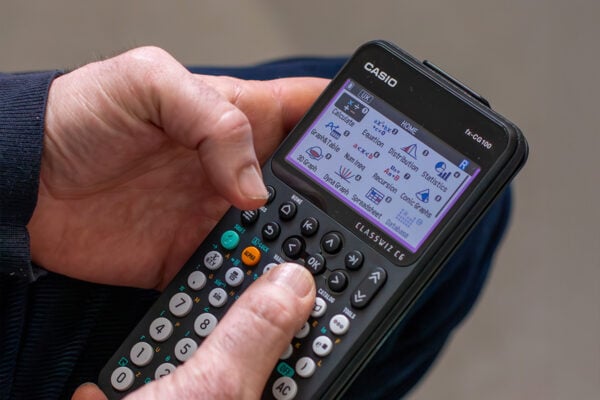
Providing a visual aid using a graphing calculator can reinforce this example and make learning more engaging. When modelling a projectile, getting students to graph the quadratic, possibly using Picture Plot and then analyse the whole thing builds a discussion about what students understand.
Introduce real life scenarios to bring problems to life
When students see the practical application of maths, it reinforces the relevance and purpose behind what they’re exploring. Use an example like the rising cost of petrol and diesel and explore the different scenarios that require maths to answer. Starting with fuel efficiency, investigate the miles per gallon for different cars and the relative cost differences for given distances or volumes. Obviously, this also requires unit conversion between litres and gallons. Then extend the investigation by asking students how this changes if driving in Europe, and they need to calculate the kilometres per litre.
Explore then what happens to the fuel cost when they have a car doing 50 miles to a gallon, and the price goes up by 10% from £2 a gallon. And how much will the journey cost if they’re doing 900 miles?
Take the investigation further by introducing how the costs would vary if someone had an electric car. Perhaps ask students to consider the cost of running an electric vehicle, including the purchase costs. Then compare the running cost for a petrol or diesel car to charging an electric car at home. What does this cost, and how does it vary depending on the price of electricity? All these scenarios can be graphed as functions on a graphic calculator. From this, you can start the discussion with students about how values change along the graph to bring together the real life situation with maths.
Using the graphing calculator to bring visuals into the classroom
Using the fx-CG50 graphing calculator introduces a hands-on visual aid that students can use to explore maths problems in greater depth. Students know about trig functions at GCSE. Building on this learning using the calculator allows students to analyse and interrogate this knowledge and expand their understanding. When starting, get them to input sin Ax. When students first sketch the graph, they will think something is wrong because they know how a sine wave should look. But explaining the value of A is initially 0 and 0 time x is 0 will start to build the foundations to understand more complex scenarios.
Then you could ask questions about what happens when students change the value of A in modify. What happens if you turn it into sine of 2x by changing the value of A to 2? And then what happens when the value of A is changed to 3? Very nicely, the calculator provides a ghost image of where it used to be, meaning students can see how it changes. It offers a good opportunity to encourage students to describe what is happening. And then, students can explore the flip side, and instead of having it as integer values, ask students to input the value of A as a negative value? Before they input it into their calculator, get the conversation going by asking students to hypothesise what they think will happen. They’ll then see that it’s almost the same graph, but not quite. Then take it further, and ask students to explore the function for non-integer values of A, and they’ll see it makes a real difference.
Changing one thing at a time and demonstrating through the graphs on the calculator how these changes impact the results introduces questions that can get students curious about maths. And it’s this curiosity that then builds motivation and interest in what they’re studying. Creating open investigations for students to discover things helps them explore maths deeper.
To help teachers motivate their students in the classroom, Casio has curated hundreds of teaching resources available to save, explore and download in the Casio Resource Centre.


