How the New Distribution App is Making Learning Easier for Students

How the New Distribution App is Making Learning Easier for Students
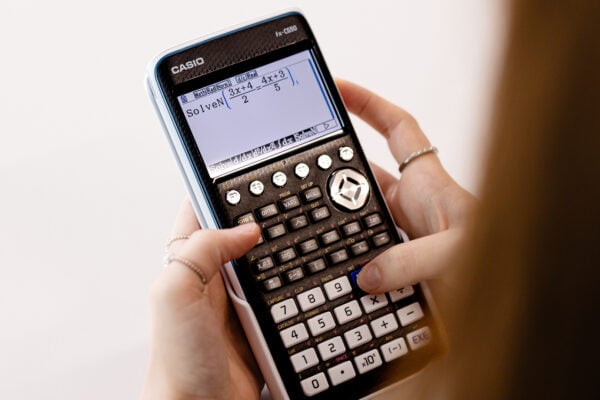
The new Distribution app on the fx-CG50 helps make learning easier and faster for students. Students can explore and interrogate scenarios more quickly and improve their understanding of complex concepts through the intuitive and visual display in the app.
We sat down with mathematician Simon May to explore the new Distribution App on the fx-CG50 and understand how it’s making life easier for students.
You may also be interested in our free training for teachers to build confidence when using the fx-CG50 graphing calculator. We also have many resources available in our resource centre to support student revision and exam preparations.
Exploring Statistical Distributions Before the Distribution App
Before getting into the details of the new Distribution app, it’s worth understanding how we’ve typically approached these calculations before it was available.
The first introduction students often have to statistical distributions is through calculating binomial probabilities because it’s relatively straightforward. One method of doing this on the calculator was in Run-Matrix, using the Option menu, where distribution calculations could then be accessed through STAT. Exact, cumulative and inverse probability calculations can then be performed. For example, choosing Bpd gives you the input screen with the syntax for entering the parameters following the same order as the distribution 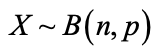 . If you remember the syntax, it’s fairly straightforward.
Another method for calculation uses Statistics, which mirrors the same choices as in Run-Matrix but with a more helpful input screen.
Using the simple example of a six sided dice, to work out the probability of rolling a five three times from ten dice rolls, intuitively students will think there’s a one in six chance of rolling a five; therefore, there’s a five in six chance of not rolling a five. It’s an exact probability, so you’d use BPD. On the calculator, students would input 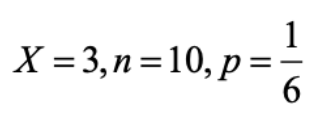 . Notice that the order of parameter input is the same as for Run-Matrix and can be used for reference. Then, you can scroll down and execute, and it gives you the probability.
You can also do cumulative calculations, finding the probability of getting either less than or greater than through a BCD calculation by using the lower and upper bounds available using the same input as before.
One of the nice things about stats mode is it’s carried forward the value of n and p from the previous calculations. You can easily find the value of the probability between rolling, for example, three and six fives. And scroll down, and it gives you the value.
You would do that if you were using Run-Matrix mode or Stats mode, which was the old way of doing things. It used to be the case of students putting the calculation into their calculator and coming up with an answer, but they still needed to know what was going on. The distribution app has improved upon this method because it now draws it as well. Previously it was quite difficult to draw it, it was doable, but you had to work around things for the discrete distribution.
Using the Table mode
You can also use Table mode to create tables of values for functions. Normally, you’d put, say, a quadratic in there and find the quadratic values between two x values in whatever interval size you choose. However, you can also create what you call binomial probability tables.
That was the old way you used to calculate things because students were provided with these tables in the exam. You still get these tables, but the exam boards have chopped most of them out because, in the new specification, students have to use calculators that can solve these probability problems. It’s a specific requirement. You’d use the calculator now for scenarios not covered in the booklet.
What you can do, is you can do a binomial probability calculation using the table and then come up with some probabilities. This feature is useful because sometimes you have to look for critical values, which is important when exploring topics like hypothesis testing. You decide when something is so unusual that you would categorise it as a bit strange. For instance, when you roll your dice 10 times, you naturally feel the probability of getting 10 fives is small. If it happened, you might think something was wrong with the dice, perhaps slightly biased in favour of rolling a five. You would do the probability calculation against a certain bar that you set as the pass mark, which is normally about 5%, or 0.05. Then if the calculation is a smaller value, you would reasonably conclude the dice is loaded, and, if it’s not, you would conclude it’s not unusual, just unexpected.
The nice thing is you can use the tables to work probabilities out using the same Run-Matrix method. However, it was a lengthy way to get to the decision, but it allowed for better understanding of the topic when creating greater than tables. Again, you have to remember the syntax, and you have to do some careful subtraction. But that was the old way of doing it.
Introducing the Distribution App
Now we can use the distribution app. There’s no syntax to remember, and both the binomial and the normal distribution are featured as the two distributions used for A level. It also caters for more distributions for students studying further maths or statistics A level. A nice feature is the way you work out calculations is the same for each distribution.
The input is similar to the way Statistics is formatted. The calculation options are placed conveniently right at the top of the screen and are easily changed, so you don’t have to scroll through.
You also don’t have to choose between BPD and BCD. And then underneath, you have clear inputs for x and n and p, just like the stats mode.
Then, when you press execute, it shows a screen with the decimal solution. When you execute this time, it gives you a graph, even for discrete distributions, and this is where the Distribution app is good because it very nicely shows you that you are trying to calculate what happens when x has a certain value.
It also shows the shape of the distribution, which is an important teaching point because you can see the skew, if any. It’s a nice visual representation.
Above the graph, you get the values you want. For the X-value entered, the probability is given. That’s not a rounded value – it’s truncated, which is an important point. Some students may just write that down. But part of the teaching should be that you can scroll across to that value and view it with Option and View to see the full decimal. You’ll also notice that it gives the value as the decimal and not in standard form.
It’s very easy to change values; you don’t need to exit from the screen to edit things, as you would in Run-Matrix. As long as you have the x value highlighted, you can change it on the screen. As a result, it is very easy to explore different values within a single view. It’s also very easy to change the probability you calculate, which is useful for symmetrical normal regions. You don’t need to exit and then, for example, choose BCD.
If you are asked what’s the value of x when it’s 5%, you input 5%. For our binomial dice roll, the calculator nicely shows it can only work out what’s happening when ![]() or
or ![]() it can’t do anything between. It tells you x is four, and that’s 7%. Immediately that gives you the right ballpark to look at and question what happens if you put it at five? Inputting five then shows you it’s less than 5%. It’s a case of two button presses to confirm the answer: It’s a lot faster. It’s a lot clearer. And there is so much less room for error.
it can’t do anything between. It tells you x is four, and that’s 7%. Immediately that gives you the right ballpark to look at and question what happens if you put it at five? Inputting five then shows you it’s less than 5%. It’s a case of two button presses to confirm the answer: It’s a lot faster. It’s a lot clearer. And there is so much less room for error.
Throughout the distribution app, it will draw the graph as standard and give you the details at the top of the screen. You have everything in one view, and you can manipulate it from within this view. For instance, if you change the values of x, you immediately see the effects of this change on the graph. Particularly with binomial probability, the fact you can draw it makes much more sense. And, with the normal distribution, you can change the probability to get the exact values of x straight away.
There is nothing wrong with the old way of doing it. But the new Distribution App is a lot more user friendly as well as easier, faster and more intuitive than the old approach.