Build student confidence during exams with these helpful tips when using the fx-CG50

The fx-CG50 graphic calculator is a powerful tool to help students perform at their best in the classroom and in exams. Sometimes, however, it’s possible to get thrown if the calculator is in the wrong setting for the question you’re trying to answer. The latest exam guidance on calculator usage and allowed models in exams is readily available, including this Pearson FAQ and OCR’s recent post on AS/A Level Maths and Further Maths.
Running a refresher for your students on the settings to watch for can help bolster their confidence as we approach exam season. We spoke to mathematician Simon May to understand the helpful features and settings students can use during the exam to ensure their calculator is set up for success. A little bit of prep before the exam can make a difference in how students feel about using their calculators during the exam. Ensuring their familiar with how to change the settings means they’ll know what to do if they get an unexpected result.
Want to help your students get the most out of the fx-CG50 graphic calculator in the classroom and the exam room? We offer free training for teachers, with our skills training sessions run by teaching experts who really know the calculator. We also have a range of resources available in our extensive resource centre, with plenty of hints and tips on using the calculator.
Check the calculator settings
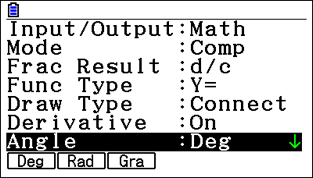
Accessing the setup menu is fairly straightforward. To do this, in Run-Matrix, go to shift and menu, the setup menu. When it comes to the basic setup, there are a couple of important things to bear in mind. First, it makes sense to turn on Derivative because it’s useful when creating tables or drawing graphs where potentially, tangents and normals may need to be considered.
Second, the default setting is radians when measuring angles when navigating around the handsets. Examiners can try and catch students out by asking questions in degrees so check students know how to change the settings.
If they scroll down to Angle in the setup menu, they can check the setting here. If degrees is needed, they can make the change by choosing that option. It will show as ‘Deg’ at the top of the screen.
There are other settings where you can scroll down a little bit, but they’re less important.
The main priority is checking students know about derivative and the angle.
Recognise if the calculator is showing the right value
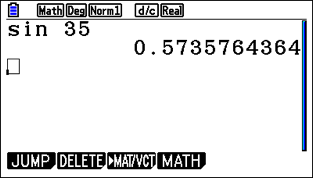
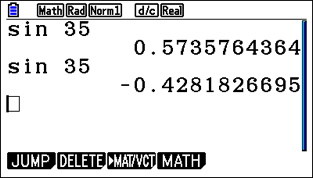
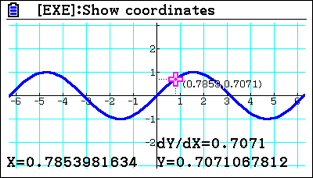
Students can confirm the correct setting by doing something as simple as sine of 35 degrees to see if it gives the correct decimal. If it’s sine of 35 radians, they will get a completely different value that they should be able to identify as incorrect.
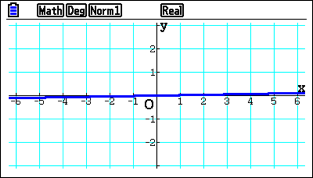
It helps students to try and graph functions, even if they’re solving an equation, as the visual cue can communicate more clearly if they have the correct value or not. Otherwise, students may not recognise it as the wrong value.
If they are drawing a function like sine of x, and it doesn’t look like the sin function they’re used to, this should prompt them to check their settings.
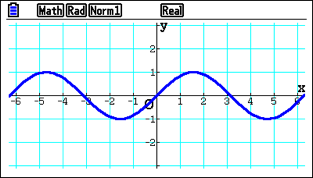
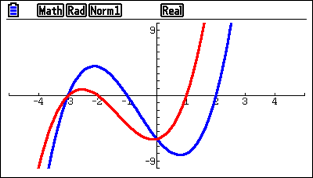
Setting up a square scale
Sometimes having a square scale is useful, as it helps students recognise the curve’s shape. Then they can see very nicely that the horizontal distance is the same as the vertical distance. They have a clear square scale, which is the graph students expect to see, and it’s also important because it helps them to sketch. This can easily be accessed from the View Window, where scale settings can be adjusted.
It also helps when dealing with tangents and normals, as it means the normal appears perpendicular to the curve. Without the square scale, they can draw a normal that doesn’t look perpendicular to the curve anymore. That can be disorienting for students, and they need to know why it’s not perpendicular to the curve.
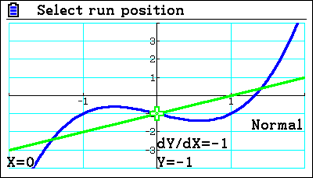
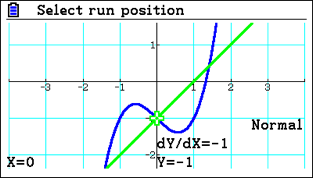
Sometimes the normal might be as simple as y=x, creating a line at 45 degrees to the horizontal. If you draw y=x on a non-square scale, it’s not at 45 degrees. This visual representation might confuse students and make them think the value can’t bey=x. Essentially, it’s about students being comfortable with what is represented on the screen and how to optimise the visual.
Using add and subtract to zoom in and out
A really quick way of zooming in or out of a graph is to use the add or subtract buttons.
It’s quite useful, as it means you can use the add button to zoom in and, if they’re not already showing, may reveal the grid lines. Students don’t need to be concerned if they can’t see the gridlines; they’re always there. Sometimes, it’s just that the current scale settings may not provide enough screen space to display them.
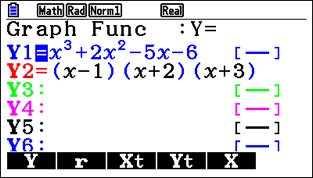
Entering factorised functions
Students may not know that they can enter factorised functions, which is helpful because it’s a good way of checking whether they’ve correctly factorised or solved a given function, such as a cubic.
Getting comfortable with different functions
In general, run-matrix is where they will do all their calculations and graph mode is where they will draw things. If in graph mode, they need to remember that if they analyse the functions with G-Solve, the further menu F6 is where they can use y cal and x cal. They’re really handy, as a common question is when y equals this, what is the x value? It’s very easy to work out what y is when x equals the value; it can be harder working out what x is when y equals the value.
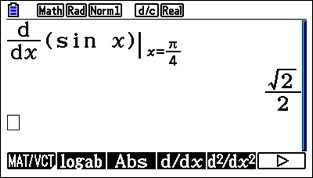
Also within run-matrix is the MATH tool, allowing students easy access to numerical differentiation and integration. They could, for instance, check the differential of a function at a point. It’s straightforward to do a calculation here, and students don’t need to be in graph mode. But if they have the derivative turned on, they could also draw the function and trace a point; then, they have the derivative shown and can explore what’s happening. However, unlike run-matrix, it’s not in exact terms; it will only display it as a decimal.
If students use run-matrix, values can be displayed more accurately, such as surds, fractions or in terms of __ it’s good to know both methods and get students comfortable with them.
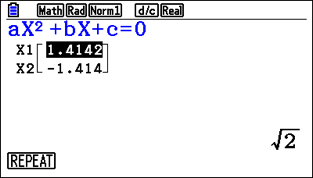
Remember there’s also equation mode
The last thing students need reminding about is Equation, which is a really useful mode, as this is where you can solve simultaneous equations or polynomials. As soon as they find that out, students love it because of the ease of calculation and the accuracy of the answers.
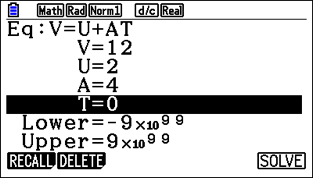
An underused function is Solver, which allows students to put in any equation.
For instance, entering one of the common SUVAT equations in mechanics gives the option to set the values of the parameters, making it much easier to solve.
If students have, for instance, three parameters with given values and they’re trying to solve for the fourth, they can input these into the calculator to find the hidden value. This approach is more straightforward than trying to do it algebraically.
They could also solve by graphing the function, but then they need to turn everything into terms of y and x.
During revision, set aside time to show students key functions and settings on their fx-CG50 calculator. Running through a few handy tricks and reminding them about important settings can help build their confidence in these final weeks and allow them to use their calculator to their best advantage during their exam.