How to use a graphing calculator: an introduction
From graphing functions to exploring statistics, we examine some of the best ways to use the fx-CG50 and fx-CG100 graphic calculator.
A graphing calculator such as the Casio fx-CG50 and the new fx-CG100 is a powerful tool for both teaching and learning, as long as it’s used efficiently.
To really get the best out of your device, you and your students need to be familiar with its essential capabilities and how they can be applied to mathematical concepts, problems and questions in exams.
So, with that in mind, let’s look at some of the most important functionality available on our most advanced graphing calculator and how you can access it.

How to graph functions on a graphing calculator
The value of graphing functions to strengthen understanding and encourage deeper analysis really becomes clear as secondary school students start to explore concepts such as solving linear equations, simultaneous equations and quadratic equations.
On the main menu of the fx-CG100, you can access the various modes available on the calculator, including Graph. This is likely to be your first port of call for graphing functions.
When you open the app, you’ll be presented with a screen where you can enter the details of the functions you want to graph. The colour of each line – which are labelled as Y1, Y2 and so on – corresponds with the colour that will appear on the next screen when each function is graphed.
Input the relevant values for each function you want to graph, then press F6 (DRAW) or EXE to draw the graph.

How to use a graphing calculator for statistics
One of the best things about a calculator such as the fx-CG100 is the range of applications it has beyond just graphing functions. As they progress in their mathematics education, students will find that combining some of the distinct features available on their handset offers great value for exploration and deeper understanding.
A good example of this is statistics – a topic that can really test the knowledge and skills of A-level maths students.
Entering Statistics mode on the fx-CG100 will take you to the List Editor screen, where you can input statistical data, perform calculations and produce graphs. By default, the calculator will display a scatter graph, but you can update the settings to present your data in several other ways, including:
Pie charts
Bar charts
Scatter diagrams
Box plots
Another key aspect of the fx-CG100’s statistics functionality that has proven popular among teachers and students since. it was introduced in 2022 on the fx-CG50 and is on the fx-CG100.
This is a dedicated app for exploring probability distributions that is designed to make students’ lives easier and help them work faster, which is a big advantage in exams.
Key benefits of Distribution mode include a much quicker and easier process to graph distributions – including discrete distributions – and the fact that you don’t have to remember any syntax.

How to explore sequences and series on a graphing calculator
Alongside Run-Matrix (for standard calculations), Graph, Statistics, Equation and other modes on your fx-CG50’s main menu, you’ll find Recursion. This is a useful feature for exploring sequences and series, particularly when working with rules that include algebra.
After entering Recursion mode, you can specify the recursion type and enter your formula.
You can also configure V-Window settings for your graph, specify the table range, select start and end values for n, and choose the line style for the graph.
Once all the required data has been entered and you’ve confirmed your settings, press F6 to display the recursion formula number table, followed by either F4, F5 or F6 – depending on what line style you want to use – to draw the graph.
This can open up various interesting routes into exploring sequences with your students. Graphs provide a visually engaging way to show the effects of changes in recursion formulae, and can also make it easier to see when a sequence exceeds a certain value.

How to create a 3D graph on a calculator
A challenge that some of your more capable A-level maths students might face is venturing beyond the 2D world of the x and y axes and starting to explore lines and planes in three dimensions.
Having access to handheld technology that helps to demystify and investigate this topic can prove highly beneficial, especially when it can be taken into exams.
The fx-CG50 – which is permitted in both A-level and GCSE exams – features a dedicated 3D Graph mode, in which you can use templates to draw 3D graphs of lines, planes, spheres and cylinders. Up to three graphs can be displayed simultaneously.
Pressing F3 while in the function list screen in this mode will take you to the template selection screen. Once you’ve chosen your template, you can input the coefficients, then press F6 (SET) to return to the function list and F6 (DRAW), or EXE, to draw your 3D graph.
To adjust how things are displayed in 3D Graph mode, press Shift and F3 to open the 3D View Window screen, where you can configure settings including the minimum and maximum values for the x, y and z axes.

Ultimately, the most effective way to build your proficiency with the fx-CG50 and get maximum benefit from it is by using it as much as possible. You could find that using the calculator regularly in lessons opens up new learning opportunities and avenues for exploration thanks to the natural enthusiasm and inquisitiveness of your students.
If you have any specific questions about adopting graphing technology or how it could benefit your school, please don’t hesitate to contact us.
Blog
- Graphing technology
- Scientific calculators
- Exams
- Curriculum
- Classroom
- Students

When is the right time to upgrade to a graphic calculator?
Read more
Preparing students using the fx-CG50 in exams
Read more
Going into exams with the fx-CG100: tips for students
Read more
Visualising and analysing statistics with the fx-CG100
Read more
Ratio: why is it such a challenge and how can a calculator help?
Read more
Using the FORMAT key on ClassWiz+ calculators
Read more
Calculator consistency: why ClassWiz+ won’t disrupt lessons
Read more
The ClassWiz+ range: what do teachers think?
Read more

Ratio: why is it such a challenge and how can a calculator help?
Read more
Why familiar tools matter in maths learning
Read more
Casio calculators compared – from year 7 to A-level
Read more
How to find standard deviation on a calculator (step-by-step guide)
Read more
Ratio: why is it such a challenge and how can a calculator help?
Read more
Why familiar tools matter in maths learning
Read more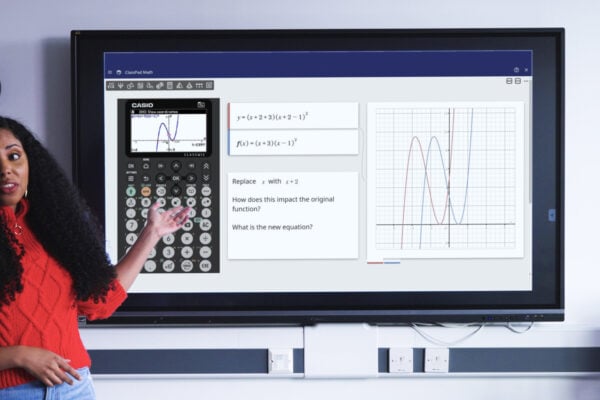
How modelling calculator use boosts student learning
Read more
Celebrating 60 years of Casio Calculators: Innovation, education and the future
Read more
Best A-level combinations: a comprehensive guide
Read more
Why is year 7 the perfect time to introduce scientific calculators?
Read more
Free scientific calculator resources to share with your students
Read more