Velocity-time graph: learn how to calculate acceleration
Master velocity-time graphs and find out how to calculate acceleration from a graph with clear explanations and examples.
Velocity-time graphs and acceleration-time graphs are concepts you’re likely to come across a lot as you progress through your GCSE maths and science studies.
In this blog, we take a close look at the definition of acceleration, the formula to calculate it and how velocity-time graphs can enable clearer analysis of this topic.
What is acceleration?
Acceleration is the rate of change in an object’s velocity (speed in a given direction) over time. It is measured in metres per second squared.
The formula to calculate acceleration is:
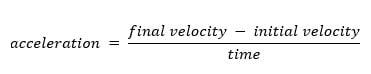
You’ll often see this abbreviated to:

In an exam question, you might be asked to demonstrate your understanding of this concept and formula by calculating the average acceleration of a vehicle, when given information about its change in velocity over a certain period of time.
How to calculate constant acceleration
These sorts of questions can be answered arithmetically by applying the formula for acceleration, but you can also strengthen your understanding and do further analysis by presenting the data graphically.
Let’s take the simple example of a car that travels from a stationary position (i.e. 0 m/s) to a velocity of 10 m/s in 2 s.
- Step 1: Identify known values
In this case, we’re told that the final velocity (v) is 10 m/s, initial velocity (u) is 0 m/s and time (t) is 2 s.
- Step 2: Apply the formula
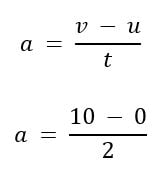
Step 3: Show the answer in m/s2
Plugging the relevant values into the formula in this case shows that the car’s acceleration is 5 m/s2.
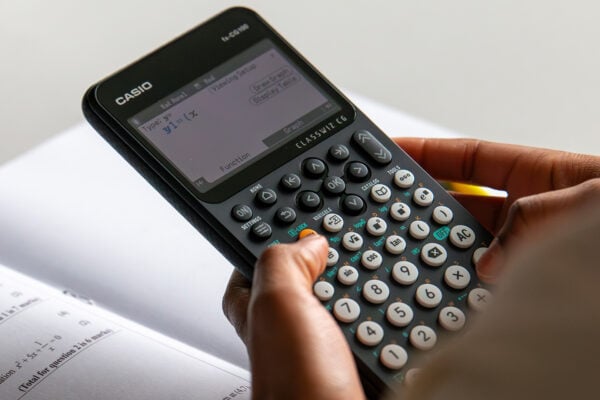
This is a rudimentary example. As the questions and data involved become more complicated, it’s beneficial to have access to an approved GCSE calculator[1] to perform complex calculations, ensure accuracy and check your work.
Using a velocity-time graph to understand acceleration
You can also calculate acceleration using the slope of a velocity-time graph. With time on the x axis and velocity on the y axis, you can add the data you have to plot a graph, the gradient of which will be representative of acceleration.
Constant acceleration will always appear as a straight line on an acceleration-time graph or a velocity-time graph.
Reading acceleration from graph gradients
Link to recently updated GCSE calculator page
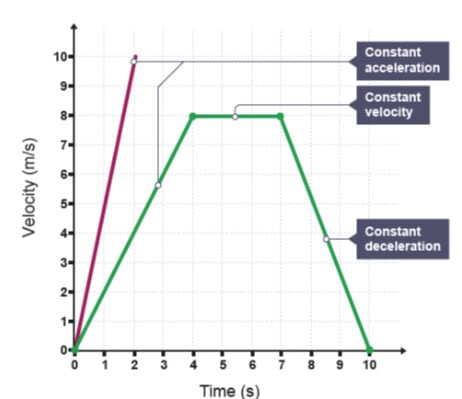
In the image above, the red graph represents the previous example of a vehicle accelerating from a stationary position to a velocity of 10 m/s in 2 s.
Working out the gradient of this line is another way to calculate acceleration.
Here’s a simple method to find the gradient of a straight line:
- Pick out any two points on the line
- Using the line as the hypotenuse, draw a right-angled triangle from one of your chosen points to the other
- Measure the triangle’s height and width
- Divide the height by the width to find the gradient
The green graph shows an object accelerating away from a stationary position to a velocity of 8 m/s in 4 s. Acceleration is therefore 2 m/s2, which can be worked out either by using the same formula, or by calculating the gradient of the line.
The object then travels in the same direction at a constant velocity of 8 m/s for 3 s, and so is not accelerating – hence the horizontal section of the graph with gradient 0. It then negatively accelerates in the same direction for 3 s to a stationary position.
It’s clear from the green graph that distinct sections can show different types of motion on a velocity-time graph.
In this case:
- The upward slope shows positive acceleration
- The flat line shows constant velocity
- The downward slope shows negative acceleration
Mastering velocity-time graphs
Getting to grips with the formula to calculate acceleration and reinforcing your knowledge by analysing data on a velocity-time graph will help you prepare to succeed in your GCSE exams.
There are lots of resources out there that enable in-depth exploration of these and many other topics, including past exam papers.
It’s also important to ensure you have a reliable scientific or graphic calculator that is approved for use in exams.
Browse scientific calculators for GCSE
Blog
- Curriculum
- Graphing technology
- Scientific calculators
- Exams
- Classroom
- Students